Thursday, July 29, 2010

Poor grammar, i.e., the grammar of graphics

The front page lead story in the Globe and Mail on July 29 highlights one of the biggest challenges faced by the human beings today, i.e., global warming. The Globe offers graphic evidence as time series charts, which depict rising temperatures on the planet over the past 100-plus years.

While the Globe should be commended for presenting graphic facts to educate its readers rather than publishing photographs of drowning polar bears, one must still point out the basic lacunae in the graphs. They are missing legends and labels for abscissa and ordinate, which diminishes their ability to inform the reader.

Without legend one does not know what different coloured lines stand for. Without axes labels one does not know if the temperatures are depicted in Fahrenheit or Celsius, or when exactly did the peaks in ocean temperature, which are visible in the graph, occur.

Since the ordinate labels are missing, one may erroneously assume that the graphs laid out in the same column, (e.g., sea level, ocean, sea-air and land-air temperatures)  experienced a proportionate change over time, which may not be true.

A graph can be worth a thousand words, provided one follows the ‘grammar of graphics’, which is perhaps as difficult to follow as the struggle with split infinitives and dangling modifiers.

Global warming graphics from Globe and Mail

A look at the original publication by the National Oceanic and Atmospheric Administration reveals that the different coloured lines represent monitoring by different agencies or authors.  The other important fact to know is that most graphs represent the anomalous deviation from some expected value and hence the horizontal black line in the above graph represents the absolute zero deviation. However, this is not true for all graphs and hence the axis labels become even more important.

The correctly illustrated graphs are available at:

http://www.ncdc.noaa.gov/bams-state-of-the-climate/2009-time-series

An example of the correct graph is reproduced below, which shows that land surface temperatures increased sharply as of late seventies, which could not be deciphered from the graph published by the Globe.

image 

Enhanced by Zemanta

A sneak peak at the new census questionnaire

While the controversy over the 2011 census in Canada continues, Statistics Canada, the agency responsible for holding Census in Canada, has released the draft questionnaire for review.

There are a few changes in the questionnaire that may make transport planners happy.

Here is a brief list of the changes that I could spot:

  1. Question 33 about unpaid work or “care economy” has been removed. It appears that the National Statistics Council had already decided upon this question, but made it look like a new suggestion in their press release two days ago. This needs more probing. The exact timing of NSC’s recommendation to exclude question about unpaid work should be established.
  2. Questions about childcare expenses have been included.
  3. Also included are questions about child support paid to former spouses.
    1. This development is interesting. The question about unpaid work, which predominantly dealt with women’s non-monetised contribution to economy and society, has been removed and a question about child support, that affects men predominantly, has been included.
  4. Transport planners should be delighted to note that in addition to the questions about the mode of travel to work, and work location, the questionnaire in 2011 will collect info on the following:
    1. Average travel time for home to work trip
    2. Departure time for home to work trip
    3. Car pooling, i.e., number of people travelling together to work in the same vehicle
    4. The mode of travel question has also been enhanced by asking details about public transit, i.e., differentiating between buses, subways, street cars, and regional rail.
      1. The question is phrased poorly as it will most likely report lower mode split for buses for multi-modal trips.
  5. And yes, the survey will be voluntary, not mandatory!

image

Lastly, I think it is not too early to start thinking about putting up a legal challenge to the government’s decision to make the survey voluntary. It is indeed  not going to be easy because the courts would not like to interfere/override the authority of the minister (executive) as enshrined in the constitution. However, there are ways to make this happen and universities with faculties of law and businesses with legal departments may want to start looking for those whose welfare will be adversely impacted by this decision and help such aggrieved parties litigate.

Enhanced by Zemanta

STATISTICS ACT of Canada

According to the act it is not merely the refusal to respond to Census, but wilfully falsifying a response to Census or any other info sought under the act may lead to a prison term.

The Statistics Act states:

False or unlawful information

31. Every person who, without lawful excuse,

(a) refuses or neglects to answer, or wilfully answers falsely, any question requisite for obtaining any information sought in respect of the objects of this Act or pertinent thereto that has been asked of him by any person employed or deemed to be employed under this Act, or

(b) refuses or neglects to furnish any information or to fill in to the best of his knowledge and belief any schedule or form that the person has been required to fill in, and to return the same when and as required of him pursuant to this Act, or knowingly gives false or misleading information or practises any other deception thereunder is, for every refusal or neglect, or false answer or deception, guilty of an offence and liable on summary conviction to a fine not exceeding five hundred dollars or to imprisonment for a term not exceeding three months or to both. 1970-71-72, c. 15, s. 29.


For the complete text of Statistics Act of Canada, please visit:

http://www.statcan.gc.ca/about-apercu/act-loi-eng.htm


Enhanced by Zemanta

From Coats to Sheikh

image Last week Dr. Munir Sheikh resigned as Statistics Canada’s chief statistician to register his protest at the government’s attempt to misrepresent the agency about its views on converting the mandatory census into a voluntary one.

Dr. Sheikh told the parliamentary industry committee that  the “fact that in the media and in the public that there was this perception that Statistics Canada was supporting a decision that no statistician would, it really casts doubt on the integrity of that agency, and I as head of that agency cannot survive in that job."

It is only appropriate to remember Robert H. Coats who was the first chief statistician of Canada who laid the foundation of Statistics Canada after being appointed as the Controller of Census in 1915.

image

Wikipedia recalls Robert Coats as follows:

Robert Hamilton Coats (July 25, 1874 – February 7, 1960) was Canada's first Dominion Statistician.

He was born in Clinton, Huron County, imageOntario in 1874, the son of Charles Coats, who came to Canada from Scotland. In 1896, Coats received a B.A. from the University College in Toronto. He worked as a journalist for the Toronto World and then the Toronto Globe until 1902 when, at the request of Prime Minister Mackenzie King, he became editor of the Labour Gazette; King himself had been the first editor of this publication which included statistical information related to labour. Coats was named Chief Statistician for the Department of Labour in 1905. In 1915, he was appointed Dominion Statistician and Controller of the Census. Coats helped establish the Dominion Bureau of Statistics, now Statistics Canada.

He also served on statistical committees with the League of Nations. After he retired in 1942, Coats served as statistical advisor to the government of Ontario and the United Nations. He served four years as visiting professor of statistics in the Department of Political Economy at the University of Toronto.

Coats, one of the first residents of Rockliffe Park, died in Ottawa at the age of 85. He had been married twice, first to Marie Hollbeister, and then, after his first wife's death, to Maida Skelly.

The R.H. Coats Building in Ottawa was named after him.

References

Enhanced by Zemanta

Tuesday, July 27, 2010

“Munir Sheikh shows us what integrity and leadership looks like”

Dr. Munir Sheikh

"Let me first of all say that it is the right of the government to make decisions, which if lawful should be implemented by any department of the government…

“The fact that in the media and in the public that there was this perception that Statistics Canada was supporting a decision that no statistician would, it really casts doubt on the integrity of that agency, and I as head of that agency cannot survive in that job."

Dr. Munir Sheikh

This story cannot be told any better than John Ibbitson of Globe & Mail in today’s online edition:

Munir Sheikh’s testimony before the Commons industry committee reminded us of something that too many forget: He did not resign as deputy minister responsible for Statistics Canada for the wrong reason; he resigned for the right reason…

“It is one thing to quit your job because you don’t agree with the boss. It is something quite different to quit your job rather than see the integrity of the people you lead compromised. There aren’t many of us who would do such a thing. But Munir Sheikh would, and did.

Enhanced by Zemanta

Self-selection bias and census

What happens when one tries to analyse women’s labour force participation using data collected from a voluntary survey. There will obviously be a self-selection bias, that is, we will observe labour force participation choice made by only those women who chose to fill out the census form. As for those women who opted not to fill the census form, we would have no knowledge about their decision to participate in labour force or otherwise.

Now armed with a data set that suffers from self selection bias, we would have to face the challenge of analysing wages for only those women who chose to fill out the form and then chose to participate in the labour force. There are now two self-selection biases in play: one dealing with filling out the census, and the other dealing with participating in the labour force.

 HeckmanThis poses interesting challenges in econometrics, as pointed out by Mathew Kahn in the Christian Science Monitor. He writes:

“The only winner here is Jim Heckman [recipient of the the 2000 Nobel Memorial Prize in Economic Sciences (with Daniel McFadden)] as his cite count will go up as smart researchers in sociology, demography and economics will have to come up with a selection correction to model who bothers to fill out the form and then a researcher studying women's labor force participation would need to estimate a second selection correction. I'd like to see somebody work out the "three step" standard error formula in this case!”

What Mathew means is that a researcher has to account for not just one, but two self-selection biases to be able to estimate unbiased coefficients in an econometric model that explains wage differentials between men and women. Obviously, this fine point will be lost on those who never made it beyond Statistics 101. For them, Mathew Kahn offers a simpler example:

“Suppose that highly motivated busy people don't bother [filling out the Census], then the "average" person in Canada will look "lazy" because the sample who fills out the survey will omit the high achievers.”

Put simply, the voluntary census long form will make Canada lazier than it really is!

Lastly, a paper published on census response rates suggested that racially and socio-economically diverse communities reported lower response rates at the county level. This implies that racial minorities are more involved in census when there numbers increase within the community.

Furthermore, the US Census Bureau in 2003 compared the response rates for the mandatory American Community Survey by sending a portion of the respondents the same survey but indicating that their response was voluntary. The change from mandatory to voluntary survey resulted in a huge 20.7% decline in response rate. At the same time the Bureau observed that the highest decline in response rate occurred in communities with high response rates recorded for the Census conducted in 2000.

These issues have serious implications for converting the mandatory long form into a voluntary survey.

Community Composition and Collective Action: Analyzing Initial Mail Response to the 2000 Census

Jacob L. Vigdor (Duke University)

The Review of Economics and Statistics, February 2004, 86(1): 303–312

Abstract

This paper analyzes how community heterogeneity influences resident decisions to undertake actions generating public benefits. The decision in question is completing and returning the 2000 Census questionnaire, an action which secures a significant amount of federal grants for the community. The model developed to explain this action allows members of societal groups to differentially value public benefits that accrue to other group members. Racial, generational, and socioeconomic class heterogeneity all predict significantly lower response rates at the county level. The potential for endogenous sorting into heterogeneous counties implies that the magnitude of true behavioral effects exceeds these estimates. Copyright (c) 2004 President and Fellows of Harvard College and the Massachusetts Institute of Technology.

Related articles by Zemanta
Enhanced by Zemanta

Monday, July 26, 2010

Do immigrants perform more unpaid work?

Happy Canada Day!

Image by Ian Muttoo via Flickr

The National Statistics Council (NSC) of Canada has suggested to axe Question 33 from the Census long form in an effort to resolve the standoff between Statistics Canada and the Conservative government of Stephen Harper.

This is the same question that Statistics Canada was unwilling to include in the long form and was overruled by the Parliament in 1995. More details on this are available in my earlier blog.

The decision to keep or eliminate Question 33 from the Census should be based on proper debate and deliberation including all stakeholders. The NSC has made an ad hoc decision to eliminate the question about unpaid work from Census that has undermined the due process of managing Census in Canada.

The inclusion of unpaid work in Census allows us to analyze the welfare of the most disenfranchised in the society.  See the following tabulation that I performed on 2001 Census for Toronto CMA. It reveals that immigrants are far more likely to engage in unpaid work than non-immigrants. Furthermore, 44% immigrant women worked more than 15 hours per week in unpaid assignments. A much lower proportion (36%) of non-immigrant women worked unpaid for more than 15 hours per week. At the same time, a smaller proportion of men (immigrant or otherwise) worked unpaid for more than 15 hours per week.

These insights would not have been possible without Question 33 about unpaid work in the Census. Are there other sources for this type of data? May be there are. But are such data  readily available to those who advise policymakers? Definitely not.

Immigrants unpaid work female male Total
none 9.5 14.9 12.1
less than 5 hours 17.5 30.0 23.4
5 to 14 hours 29.2 34.6 31.8
15 to 29 hours 23.4 14.1 19.0
30 to 59 hours 14.1 5.0 9.8
60 hours or more 6.4 1.5 4.0
Total 100.0 100.0 100.0
15+ hours 43.9 20.6 32.8
Non-Immigrants unpaid work female male Total
none 8.5 14.5 11.4
less than 5 hours 22.7 35.0 28.7
5 to 14 hours 32.6 33.5 33.1
15 to 29 hours 21.1 12.6 16.9
30 to 59 hours 10.5 3.6 7.2
60 hours or more 4.5 0.9 2.8
Total 100.0 100.0 100.0
15+ hours 36.1 17.1 26.8
Enhanced by Zemanta

The Statistics Council’s compromise on Census hurts Women!

The National Statistics Council (a body established under the Statistics Act to offer advice to Chief Statistician) has suggested a compromise that would mean leaving the census mandatory, relaxing penalties for non-compliance (no more jail time threats), and removing Question 33 about unpaid work from the 2011 Census.

I have serious concerns about eliminating Question 33, which tries to capture the extent of women’s role as primary caregivers in society. Question 33 (see the question below) asks about unpaid household work, time spent looking after children, and providing care for elderly parents. Removing this question from the Census in 2011, as suggested by the National Statistics Council, will be a great disservice to Canadian women, who indeed account for most unpaid work, and therefore face the trade off between pursuing corporate careers and taking care of the vulnerable in the society, i.e., children and elderly.

In its recommendations, the Council should have suggested an alternative (a new survey perhaps or modifying the existing surveys, such as the one on volunteering, etc.) to eliminating Question 33.

Also, I wonder how many women serve on the National Statistics Council and what was the reaction of those women about the suggestion to axe Question 33 about the unpaid work.

Question 33 in the Census long form.

clip_image002

Two-times as many women than men work unpaid for more than 15 hours/week

According to Statistics Canada:

Unpaid work in Canada

1996

2001

2006

% of males reporting any hour(s) of unpaid work 86.7 88.4 89.5
% of females reporting any hour(s) of unpaid work 93.2 93.4 93.5

The 2001 Census presents a breakdown of the weekly unpaid work by gender. The numbers below suggest that the category of longest duration of unpaid work (15 hours or more) is heavily dominated by women. For instance, 45% women and only 23% men reported working for more than 15 hours for unpaid work.

2001 Census Total Male Female
Individuals eligible for answering Question 33 23,901,360 11,626,785 12,274,570
No hours of unpaid housework 10% 13% 8%
Less than 5 hours of unpaid housework 24% 30% 17%
5 to 14 hours of unpaid housework 32% 33% 30%
15 to 29 hours of unpaid housework 20% 15% 24%
30 to 59 hours of unpaid housework 11% 6% 15%
60 hours or more of unpaid housework 4% 2% 6%
Total - Hours spent looking after children, without pay 100% 100% 100%
No hours of unpaid child care 62% 66% 58%
Less than 5 hours of unpaid child care 10% 11% 9%
5 to 14 hours of unpaid child care 10% 10% 9%
15 to 29 hours of unpaid child care 7% 6% 7%
30 to 59 hours of unpaid child care 5% 4% 6%
60 hours or more of unpaid child care 6% 3% 10%
Total - Hours spent providing unpaid care or assistance to seniors 100% 100% 100%
No hours of unpaid care or assistance to seniors 82% 85% 79%
Less than 5 hours of unpaid care or assistance to seniors 12% 10% 13%
5 to 9 hours of unpaid care or assistance to seniors 4% 3% 5%
10 to 19 hours of unpaid care or assistance to seniors 1% 1% 2%
20 hours or more of unpaid care or assistance to seniors 1% 1% 2%
Statistics Canada - Cat. No. 95F0390XCB2001004      

The 2006 data are presented below:

2006 Census Total - Sex Male Female
2006, total individuals over 15 years 25,511,870 12,395,135 13,116,740
No hours of unpaid housework 10% 12% 7%
Less than 5 hours of unpaid housework 24% 30% 18%
5 to 14 hours of unpaid housework 32% 34% 31%
15 to 29 hours of unpaid housework 20% 16% 24%
30 to 59 hours of unpaid housework 10% 6% 14%
60 hours or more of unpaid housework 4% 2% 6%
Total - Hours spent looking after children, without pay 100% 100% 100%
No hours of unpaid child care 62% 66% 59%
Less than 5 hours of unpaid child care 10% 10% 9%
5 to 14 hours of unpaid child care 9% 10% 9%
15 to 29 hours of unpaid child care 7% 7% 7%
30 to 59 hours of unpaid child care 5% 4% 6%
60 hours or more of unpaid child care 7% 3% 10%
Total - Hours spent providing unpaid care or assistance to seniors 100% 100% 100%
No hours of unpaid care or assistance to seniors 82% 84% 79%
Less than 5 hours of unpaid care or assistance to seniors 11% 11% 12%
5 to 9 hours of unpaid care or assistance to seniors 4% 3% 5%
10 to 19 hours of unpaid care or assistance to seniors 1% 1% 2%
20 hours or more of unpaid care or assistance to seniors 2% 1% 2%

Source: Statistics Canada - 2006 Census. Catalogue Number 97-559-XCB2006007.

---------

For those interested in determining the efforts behind getting the question 33 added to the census, I suggest the following article from Studies in Political Economy:

Studies in Political Economy, Vol 56 (1998)

Where Women's Efforts Count: The 1996 Census Campaign and "Family Politics" in Canada

Meg Luxton, Leah F. Vusko

Abstract

After more than ten years of organising and lobbying by women's groups, the 1996 Canadian Census included, for the first time, a detailed question about the amount of time people spend on unpaid housework and care giving for children and seniors. According to Statistics Canada, this information was collected to "provide a better understanding of how these unpaid activities contribute to the well-being of Canadians." However, behind this formal explanation lies an on-going political struggle over who is or should be responsible for the socially necessary work of taking care of people, especially dependent children and elders, and how that work should be socially recognized and organised.

Full Text: PDF

Studies in Political Economy:
Online ISSN 1918-7033
Print ISSN 0707-8552

Some background on unpaid work question in Census

The motivation came from the United Nations:

“International Developments The roots of the 1996 Census campaign may be traced to the Third United Nations World Conference on Women in Nairobi in 1985 where the International Wages for Housework Campaign presented a motion that led to the UN resolution contained in paragraphs 58, 64, 20, 130 and 179 of the Forward-Looking Strategies for the Advancement of Women. This resolution directed countries to:

  1. provide gender specific data;
  2. recognise the remunerated and unremunerated contributions of women in national economic statistics and the gross domestic product, especially those contributions of women in agriculture, food production, reproduction, and household activities;
  3. improve the capabilities of national statistical institutions to implement these concepts and measure regular programs;
  4. strengthen, monitor and evaluate statistics and indicators on women; and
  5. provide training for producers and users of statistics on women.”

Carol Lees, an unsung hero

“At this juncture, Saskatchewan homemaker Carol Lees refused to fill out the 1991Census because it did not recognise her unpaid domestic work. Picketing a federal government building in Saskatoon and challenging the government to arrest her, her efforts attracted support from other women's groups - for example, the Saskatchewan executive of the National Council of Women of Canada (NCWC) picketed with her - and generated widespread media coverage.”

Statistics Canada did background research

“Statistics Canada also held an international conference in April 1993 on the "Measurement and Valuation of Unpaid Work."24 Billed as a conference of international "experts," women activists in Canada were .initially not invited. For many women, this experience of exclusion reaffirmed the government's dismissive attitude towards women's groups and their concerns. However, many women protested and, eventually, invitations were extended to representatives from ten women's organisations.”

Statistics Canada reluctant to add question on unpaid work

“Statistics Canada took the position that the Census was an inappropriate place to measure unpaid work upon completing extensive consultations and a Census Pre-Test. In making this assessment, Statistics Canada suggested that the Pre-Test indicated that a Census question on unpaid work, "was liable to produce inaccurate and insufficient data as well as results that were ill-suited to guiding public policy-making and further research on unpaid work."54 Subsequently defending its views to the media, Assistant Chief Statistician Bruce Petrie noted that "testing to date has shown that the Census is not the appropriate vehicle for collecting data of this type.”

The Parliament over-rules Statistics Canada on unpaid work

“Cabinet was scheduled to make its decision early in 1995. However, it repeatedly delayed its announcement. Finally, during the Fourth United Nations World Conference on Women in Beijing, where Canadian delegates were in the leadership in negotiating new language on measuring and valuing unpaid work the Canadian government announced its decision to add a question to the 1996 Census. In a rare move, it had overruled Statistics Canada. Cabinet did not give any explanation either for the delay or for the basis of its decision. For undeclared reasons, the Canadian government appeared to respond to political lobbying from women's groups, against the advice of Statistics Canada, and made its announcement at the height of international attention.”

The National Statistics Council presented the following recommendation to the government:

Seeking Solutions by NSC

The National Statistics Council, the senior, external advisory group appointed by the government of Canada to advise the Chief Statistician, is deeply concerned by the effect of the announced changes to the 2011 Census. We believe that the changes will harm the integrity and quality of the Canadian statistical system. At the same time, the Council recognizes that concerns about intrusiveness and confidentiality should be addressed.

It is urgent we find solutions that protect the quality of the information Canadians depend upon while responding to concerns over the way in which the Census is conducted.

What is at risk?

First, the proposed, voluntary National Household Survey will suffer from significant respondent self-selection bias. Even with substantial efforts to mitigate the inevitable decline in response rates, this will degrade the data upon which much of the Canadian statistical system is based.

The proposed changes will likely result in Statistics Canada’s not being able to publish robust, detailed information for neighbourhoods, towns or rural areas. Much of the analytic work done by municipalities, private firms, health agencies, highway and transportation planners, school boards and large numbers of other groups that depend upon small-area knowledge and data will no longer be possible.

Our second concern is the potential loss of vital benchmark information. The mandatory ‘long form’ means that Statistics Canada has an accurate benchmark for the demographics of populations who are difficult to reach or who are less likely to complete a voluntary survey. This, in turn, means that sampling and weighting strategies for subsequent, voluntary surveys can compensate for differential response rates and produce more reliable information.

The importance of having Census benchmarks available is readily apparent when one considers some of the populations that we know are more difficult to reach – young people making the school-to-work transition, urban Aboriginal populations, the affluent, and new immigrants.

Without solid benchmark information, subsequent surveys and analysis rest on an uncertain foundation. The Bank of Canada cautiously stated that, while they do not use long-form data directly, they feel they will have to evaluate “the impact that any proposed change would have on the reliability and the quality” of economic data they use. The Bank’s statement exemplifies the repercussions the changes may have over the broader Canadian statistical system.

The National Statistics Council also recognizes the concern that Canadians not be overburdened by governments compelling them to respond to onerous or intrusive demands for unnecessary information. On a number of occasions, the National Statistics Council has urged changes and worked with Statistics Canada to reduce such respondent burden. With respect to the Census, the Council has strongly supported changes to data collection methods that enhance privacy such as mail-in and on-line options.

In addition, the Council strongly supports Statistics Canada’s commitment to the complete confidentiality of respondent information and it recognizes the agency’s undisputed success in reaching this goal. The Council shares the Privacy Commissioner’s Office view that Census questions are ‘inherently privacy-invasive’ and that the questions must be kept to what is necessary for good government and that the information gathered must be protected with the appropriate safeguards.

This focus on minimizing intrusiveness and protecting privacy is important to retaining the confidence of Canadians. We are satisfied that Canadians trust Statistics Canada and its procedures and that Canadians provide answers they would be unwilling to provide to a private survey firm. The Council also believes that confidence must be sustained through ongoing actions.

In a matter of a very few weeks at most, it will be impossible to change the 2011 Census or the National Household Survey. Meanwhile, debate over the future course of the Census has become heated without moving towards a resolution that meets both concerns about privacy and intrusiveness, as well as the need to maintain the quality of Canada’s statistical system. What then do we recommend?

The National Statistics Council recommends:

  1. That, as part of a formal consultation process beginning with the 2016 Census, Statistics Canada examine each Census question to ensure that it, at a minimum, meets one of the following tests for inclusion in the Census:
    1. It is required by legislation or Cabinet direction,
    2. It is needed for small-area data uses for which there is no alternative data source,
    3. It is needed to create benchmarks for measuring difficult-to-reach groups and ensuring that subsequent surveys or data derived from administrative sources can be sampled or weighted to reflect accurately the overall population,
    4. It is needed to assess progress on issues of national importance, for example the economic integration of new immigrants, or
    5. It is to be used as a basis for post-censal survey sampling of relatively small or dispersed groups, for example, urban Aboriginals or people with health conditions that limit their activity.

Even if a question met this requirement, it would still face tests of its overall importance to the Canadian statistical system and the needs of data users as weighed against cost and the intrusiveness of the question.

  1. The Council is aware that other countries have conducted successful censuses without people having to face the potential of jail as a punishment for not filling out census forms. We, therefore, recommend that the Statistics Act be amended to remove jail sentences as a possible punishment for not filling out the Census. At the same time, the Council recommends that jail continue to be a punishment for those who wilfully break confidentiality provisions.
  2. That the Census for 2011 include the long form being used for 20% of the population as the only way, given the very short timeframe, to safeguard the quality of the Canadian statistical system.
  3. That the question series on household activities (question 33 in the 2006 long-form Census) be dropped as it was the question that occasioned the largest number of objections among the substantive questions and since it fails to meet any of the five tests outlined in point 1.

The National Statistics Council believes that these steps, taken together, can respect the valid concerns voiced by Canadians about privacy and intrusiveness, while ensuring that the vital information that currently flows from the long-form Census can be maintained and continues to serve Canadians’ needs.

Ian McKinnon,

Chair, The National Statistics Council

National Statistics Council

Establishment of the National Statistics Council

In the early 1980s Statistics Canada embarked on a conscious program of strengthening its active consultative mechanisms with key clients and broadly based representatives of the national interest. Among the major new initiatives were the establishment of a series of bilateral senior committees with key federal departments – both clients and sources of data derived from administrative records (this supplemented already existing strong consultative mechanisms with the provinces); and some 10-15 professional advisory committees were set up. The latter involved experts (typically from outside government) in such areas as demography, labour, national accounting, price measurement, service industries, etc.

In 1985, the government established, at the apex of the Agency's consultative mechanisms, the National Statistics Council. Its formal mandate is very brief: it is to "advise the Chief Statistician in setting priorities and rationalizing Statistics Canada programs". In line with other aspects of Canadian policy in relation to statistical activities, a careful balance was attempted between policy relevance and professional independence.

Appointment process and membership

Members of the Council are appointed for a period of three years but subject to renewal. There are about 40 members. While there are no rules for representation, the following practice has generally been adhered to:

  1. All members serve in their individual capacities – there are no formal representational appointments;
  2. Most members are interested and prestigious analysts of some aspect of Canadian life, but few are professional statisticians;
  3. Some members from Statistics Canada's various professional advisory committees serve on the Council. This ensures the availability of a wide range of subject matter knowledge within the Council, as well as linkage with the Agency's other advisory bodies;
  4. A senior member from the Statistical Society of Canada sometimes serves;
  5. At least one senior journalist on social or economic affairs is a member;
  6. Membership is selected in such a fashion as to ensure appropriate knowledge of the different provinces and territories of Canada ;
  7. No federal official is a member of the Council. This enhances the de facto independence of Council to "speak up" should it be necessary;
  8. The Chief Statistician is an ex officio member;
  9. An Assistant Chief Statistician serves as secretary.

A large proportion of the initial members, were appointed by the Minister from a list of persons recommended by the Chief Statistician. Subsequent appointments have been proposed to the Minister by the Chief Statistician following discussions with the Chairman of the Council.

As a result of these measures, the Council is a very knowledgeable, influential and broadly representative group. Indeed, its influence derives from the individual prestige of its members.

Agenda and Modus Operandi

The Council normally meets twice a year, each time for a day and a half. Regular agenda items are “Statements by Members” in which Council members may raise questions or concerns either for immediate response or subsequent discussion, and an in-depth report by the Chief Statistician on recent developments at Statistics Canada (including new substantive initiatives, forward planning, budgetary expectations). Other agenda items usually deal with major statistical or policy issues – such as: Census content, Environment statistics, Longitudinal data, Issues in social statistics, National accounts, Dissemination practices, Pricing policy, Privacy and record linkage, Contingency planning in the face of expected budget cuts, the Provincial component of the national statistical system, Significant statistical information gaps, etc.

Agenda items are selected from items raised by members and issues identified by Statistics Canada in discussions with the Chairman. From time to time a subgroup of the Council is formed to deal with particular issues (e.g. access to historical censuses) between Council meetings.

The Council generally provides feedback to the Chief Statistician through a discussion among its members. Consensus is usually (though not always) achieved.

Conclusion

There can be no doubt that members of the Council take their function seriously. The Chief Statistician regards their advice as being of very substantial benefit. In addition, through the prestige of its members and through precedent, Council has evolved into an additional and – should the need arise undoubtedly very influential – bulwark in the defence of the objectivity, integrity and long-term soundness of Canada’s national statistical system.

Enhanced by Zemanta

Saturday, July 24, 2010

Is R not at the cutting edge of Econometrics?

I landed on Freakonomics blog on an entry by Ian Ayres, the author of the book Super Crunchers. He wrote:

And R is probably not kept up to speed on the cutting-edge empirical methods as quickly as the traditional packages.

This is certainly not true and in fact the commercial packages often take years to implement the recent developments in econometrics. Consider that SPSS still does not offer routines to run Discrete Choice Models even when Prof. Daniel McFadden received a Nobel in Economics for his work in discrete choice (conditional logit) models.

I also recall paying annual license fees for S-Plus in between 2000 and 2004 and hardly received any update for my renewed annual licenses.

Then why would Ian suggest that R is not at the cutting edge of econometrics. But wait,  Ian admits that he may not be the most objective person on this matter since  he admitted that “SPSS and SAS have paid me handsomely to give Super Crunching talks, so I may not be the most objective observer.”

R perhaps is the most up-to-date statistical package since most new algorithms are being coded in R. Why? Because those who code new algorithms would like to have their algorithms receive the widest circulation. R makes it possible because it is freely available and anyone can run the new algorithm without spending a dime on license fees.

Also, SPSS sent me an invoice of $7,600 upgrade my license. R was free and much more powerful. Guess what platform did I choose!

Enhanced by Zemanta

Grammar of graphics

MEG data plotted with ggplot2Image by pealco via Flickr
The grammar of graphics is a fine attempt to teach analytic graphics. Developed for the freeware statistical software R, the ggplot2 module is indeed a fine tool to use graphs to analyze data.
 Hadley Wickham has announced that new versions of his popular grammar-of-graphics charting package ggplot2 and his general-purpose data reshaping tool plyr for R are now available. 

Some graphs created by ggplot2 are indeed work of art, especially the ones where multivariate data are presented in a single graph, such as the histogram matrix.

Microsoft Excel while made charting easy for those who were not empirically inclined, however, the 3-D graph options and the like made way for certain very ugly and misleading graphs. Nathan Yau's Seven Basic Rules for Making Charts and Graphs is indeed a good starting point for those who are itching to use graphs, but do not know where to begin.


Enhanced by Zemanta

Zemanta: Bloggers’ assistant

There are times you wish you had an assistant to provide you with the facts and data as you are busy writing your blog. Zemanta offers a tentative solution. While you write your blog, it tries to provide you with the background material.

Let’s take Zemanta for a test drive. I would like this blog about the rising debt levels amongst Canadians. A recent Bloomberg story highlighted the fact that Canadians are getting more and more into debt. That is the ratio of debt to  disposable income for households have been on the rise.  If these trends continue, Canadian households are likely to pullback spending in the months to come.

The household debt has been rising in the US as well. See the image below that suggests that the household debt in the US has peaked.

According to an entry on Flickr:

On December 10th, the Federal Reserve released its latest  lHousehold Personal Debt 10 Dec 09
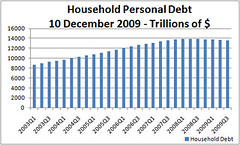
atest findings on Consumer Debt Outstanding. In reflection of good personal choices, personal debt went down by 2.6% for the third quarter 2009. This is amazing because it brings the total personal national debt down to around $13.6 trillion. Also, for the first time ever, personal debt did not grow for the fifth quarter in a row. This decrease was due to a 13.6% drop in household home mortgage debt AND a 3.2% drop in consumer credit.


Image by eric731 via Flickr        

How did I get this image? Zemanta suggested it.

What about other related stories and information. According to Windsor Star, Canada’s household debt has reached $1.4 trillion. I didn’t search for this. Zemanta suggested it. By the way notice the 10% rule. If the US households are carrying $14 trillion in household debt, their Canadian counterparts would carry 10% of the US amount.

Another story in Toronto Star on May 11 refers to the fact that Canadian households are the most indebted people living in the advanced countries, according to OECD.

How do I know this? Zemanta suggested it.

Lastly, the Bank of Canada's governor offered the following comment on household debt in Canada in a Reuters' story:

"We don't expect a sharp uptick in household savings in Canada. Again, that is one of the risks to the projection that there could be a repair of household balance sheets, or an increase, I should say, in household savings in Canada. All of that said... household balance sheets in Canada are in quite strong shape and that is one of the big differences between Canada and the United States."

Who searched this item for me? Zemanta did.

Enhanced by Zemanta

The Econometrics bestsellers

A look at the global bestsellers (sold through Amazon) returns the usual suspects for Econometrics. If you are interested in learning about the top 10 best selling books in econometrics in the US, Canada, England, Germany, and France, click HERE. The top-3 bestsellers in July 2010 in the US, Canada, and UK are presented in the image below.

image

There is an interesting similarity in the choices made by consumers located thousands of miles apart. Consider that Mostly Harmless Econometrics: An Empiricist's Companion by Joshua D. Angrist et al. is listed in the top-3 texts sold in the three large English speaking markets. Also listed twice is Jeffery Wooldridge's  Econometric Analysis of Cross Section and Panel Data, which suggests that longitudinal analysis may be in vogue.

Chris Baum’s  An Introduction to Modern Econometrics Using Stata is a bestseller in the UK. This book is a must have for applied econometricians who may not be interested in inverting matrices or computing  gradients and Hessians!

Friday, July 23, 2010

Who digs Econometrics?

Econometrics is a hard science. it involves advance calculus and thus it is not appealing most interested in the American or Indian or some other Idol.

Globally, an interesting landscape emerges for the interest in econometrics. Based on the searches performed on Google between July 2009 and July 2010, Washington, DC, appears to demonstrate the highest interest in econometrics as is evidenced by the normalized searches for the word econometrics performed from Washington, DC.

Singapore comes second in the interest in econometrics. However, being a financial and academic hub, it should not be much of a surprise. New York, with the abundance of financial services firms and higher education institutions comes third. Also, Bill Greene, author of Econometric Analysis, and Robert F. Engle, Noble Laureate in Economics for ARCH and GARCH models, both reside and teach in New York.

Delhi at 4th suggests the fast and sustained rise of the academia in India. New Delhi is the federal capital of India and is also home to a large number of institutions of higher learning. Econometrics must be important to them all.

With David Hensher in Sydney, I am not surprised at Sydney being 5th. There is a growing interest in discrete choice econometrics in Sydney. Toronto on 6th may not be a big cause to celebrate until one realizes that London is trailing Toronto at 7th.

In summary, the top ten cities interested in econometrics are the cities of knowledge and econometrics is the tool of choice for many a researchers.

image


The following graph is live and presents the phrases that internet surfers have used while searching for econometrics. Notice that Jeffery Wooldridge, author of the famous text Introductory Econometrics, is listed among the top ten searches for econometrics.

Thursday, July 22, 2010

Statistics Canada, Dr. Munir Sheikh, and the long form

Yesterday was indeed a sad day for public servants in Canada when one of their finest had to resign in order to best serve his country. Dr. Munir Sheikh, in his resignation letter, has offered Statistics Canada’s assessment that a voluntary survey cannot be a substitute for the mandatory survey.

The controversy started with the federal government trying to change the mandatory nature of the long form of the census to a voluntary one. The Industry Minister implied all along that his decision was backed by the world reputed Statistics Canada. Dr. Sheikh’s resignation letter (which was hurriedly removed from the agency’s website today, but we had preserved it yesterday) however has set the record straight.

Munir_Sheikh_resignation

Industry Minister Tony Clement claimed multiple times that Statistics Canada was in agreement with his decision to change the survey form. Munir Sheikh’s resignation proves that this was never the case.  We believe that Minister Clement should therefore resign as a minister and as a member of the Parliament for misrepresenting and maligning one of Canada’s finest institution.

It was only a few weeks ago that Minister  Clement asked Canadians to trust Statistics Canada on the controversy surrounding census’s long form. In his resignation letter, the former chief statistician, Dr. Munir Sheikh, has explicitly stated that the voluntary survey cannot be a substitute for the mandatory survey.

I do trust Statistics Canada and after learning the agency’s opinion, I now request Mr. Clement to reverse his decision, which has already been criticised by academics, businesses, and charities.

Mr. Clement had also argued that some of the data collected in the long form was not needed by the government. This is hardly the case unless one assumes that Minister Clement represents all government in Canada. The opposition to his decision by most provincial and all municipal governments suggest that Mr. Clement has exceeded his authority by making a statement on behalf of all tiers of governments and crown corporations, who rely on the census to deliver critical services to Canadians.

Minister Clement has further argued that the decision to change mandatory long form census to voluntary was based on the government’s belief that it should not ask intrusive questions of Canadians. This gives the impression that Prime Minister Stephen Harper’s government respects individual rights and freedoms.

The reality, however, is quite different. This is the same government that refused to spend a dime of foreign aid to provide safe abortions to women in developing countries. It’s a government so blinded by its ideology that it felt entitled to tinker with women’s health. This government is not even remotely concerned about individual’s rights and freedoms.

It is imperative for Canadians to speak out to prevent this government from doing irrevocable damage to Statistics Canada and to ensure that informed decision making practices, which rely on Census data, continue in Canada.

Lastly, Minister Clement is wrong in defending his government’s unconsidered decision to change the long-form census survey from mandatory to voluntary.  The fact that some may find it onerous to respond to long-form census survey is not a sufficient reason to change the nature of Canada’s census.

It also sets a wrong precedent for Statistics Canada who conducts numerous other industry surveys.  The Canadian businesses will not be far behind asking for exemption for the same reason from Statistics Canada’s industry surveys.

The Minister is also misguided in his assertion that the voluntary survey will have a larger unbiased response. The US Census Bureau in 2003 compared the response rates for the mandatory American Community Survey by sending a portion of the respondents the same survey but indicating that their response was voluntary. The change from mandatory to voluntary survey resulted in a huge 20.7% decline in response rate.

Lastly, the US Census Bureau also concluded that the voluntary survey would be much more expensive ($59.2 million more in 2005 dollars) to conduct than the mandatory survey.

Canadians will be well-served if Mr. Clement would come to his senses and leave the census as is. Or better, he should simply resign.

Sunday, July 18, 2010

Are housing prices falling in major urban markets in Canada?

A quick answer is yes. However, a detailed look at the graph below, which presents a month-by-month account of seasonally adjusted housing prices in the major urban markets in Canada, suggests that housing prices have faltered as of April 2010 in three major urban markets, namely Toronto, Calgary, and Edmonton, which have also pushed the overall average housing price in Canada lower in the recent months.

The graph presents seasonally adjusted housing prices for the major urban markets in Canada including Vancouver, Calgary, Edmonton, Saskatoon, Toronto, Montreal (truncated), and the average value for Canada.

The most inflated housing market in Canada is that of Vancouver, which is going strong and is only $30,000 shy of reaching the $700,000 average housing price landmark. Since March 2009, the Vancouver housing market has appreciated by $172,000. This is certainly an unsustainable pace of price appreciation. At $11,450 per month in average price appreciation the housing market in Vancouver has certainly outpaced any growth or gain in wages. Thus, a mild decline in housing prices in Vancouver should be forthcoming unless offshore investors yet again bailout the inflated prices in Vancouver.

The average annual price appreciation in Toronto at $6,700 from February 2009 to March 2010 is certainly much less hyped than the one observed in Vancouver. Housing price losses should therefore be milder in Toronto than in Vancouver.

Saturday, July 17, 2010

Canada’s housing markets, some reflections

The Canadian housing markets, as of late, have alarmed many a households and economists in Canada. Unlike the United States, where the housing market struggles even today to dig its way out of the housing slump, the Canadian housing markets started to recover as early as in January 2009. The sudden reversal in housing fortunes in Canada is indeed a concern for the market watchers and seller households searching for home buyers.

The Canadian housing recession was relatively short-lived. The nominal housing prices after rising steadily since 1996 dropped only  in 2008. Starting January 2009, the housing prices in Canada started their upward climb, which  continued until April 2010. However, the past few months have revealed a dismal state of affairs in the Canadian housing markets where prices have started to decline again. This is happening during summer months when housing markets in Canada usually heat up.  It is the time when multiple bids become the norm.

As the housing prices decline month after month, economists and government policy makers wonder if this is going to be a double-dip recession.

I have argued previously that the rise in housing prices in Canada in 2009 could be attributed to constrained supply rather than other market fundamentals (such as interest rates, wages, and unemployment), which have not changed much during the recent months.  The support for this argument could be found in the above graph.

In November 2008, there was an abundant supply of resale housing in the market.  The sales to listing ratio stood at 0.38, suggesting that there were 2.7 homes listed for each sale.  However, this also suggests that more sellers were active in the market than buyers.  This resulted in a drop in housing prices, which in turn brought in more buyers to the market. 

As the buyers returned to the market, the sales to listing ratio started climbing upwards from a low of 0.38 in November 2008 to 0.64 in June 2009.  In a short span of seven months, the market turned from abundant supply to constrained supply.  For every home sold in June 2009 there were only 1.5 homes listed in the resale market.  The immediate effect of constrained supply in the housing market was a steady rise in housing prices that began in January 2009 and lasted until April 2010.

As the prices climbed swiftly in 2009, they soon reached the point where buyers withdrew  from the market.  By October 2009, the sales to listing ratio had peaked.  Starting November 2009 the sales to listing ratio declined steadily and did not reverse the trend.  As more sellers entered the market than buyers, it was only a matter of time that housing prices would also reverse their direction and start declining.

Given the fact that housing markets take time to react to new information, it should come as no surprise that the changes in the demand and supply of new housing influence housing prices with a lag of few months.

Statistics Canada needs guts

Industry minister Tony Clement has asked Canadians to trust Statistics Canada for his decision to scrap the mandatory long census form and replace it with a voluntary questionnaire. The Canadians would trust Statistics Canada if they knew where it stood on this matter.

Dr. Munir A. Sheikh, Canada’s chief statistician who was handpicked by the Harper government in 2008 to lead the agency, has refused to speak on the matter.  He has declined an interview request from The Canadian Press. His silence on the matter has made Minister Clement the de facto chief spokesperson for the agency.

Canadians expect strong leadership from their chief statistician. The former chief statistician of Canada, Dr. Ivan Fellegi, has told The Canadian Press that he would have quit his job in protest had the government tried to pull this stunt during his tenure.

Statistics Canada has already lost the trust of most Canadians by following an executive order instead of first consulting with those who rely on its data. Dr. Sheikh must speak directly to Canadians and explain why he believes the unanimous opposition by Canadian academics, businesses, charities, and medical professionals to scrap the mandatory long census form is misplaced.

Monday, July 12, 2010

Data Visualization

As the computer's became cheaper, and the Internet became ubiquitous, data have transformed from being scarce to abundant.  With gigabytes of data available on almost everything that one can think of, the new challenge facing analysts is how to analyze and present data.

Data visualization has emerged as a key tool to present synthesized data to a larger audience.  The World Bank through Google has made significant strides in opening up its databases and, more importantly, developing tools to present animated data that have been held in digital and paper format in the Bank’s archives.

The British News magazine, The Economist, has also been at the forefront of creating innovative graphics.  The latest is a dynamic interactive graph depicting housing price indices in most developed economies. 

Please click here for the interactive graph.

image