Wednesday, August 10, 2016
So you want to be a data scientist
Wednesday, January 13, 2016
Getting Started with Data Science: Storytelling with Data
The very purpose of authoring this book was to rethink the way we have been teaching statistics and analytics to students and practitioners. It is no secret that most students required to take the mandatory stats course dislike it. I believe it has something to do with the way we have been teaching the subject than to do with the aptitude of our students. Furthermore, I believe there is a greater opportunity to equip the students with the skills needed in a world awash with data where competing on analytics defines the real competitive advantage.
No wonder, the latest issue of the leading publication on the subject, The American Statistician, is dedicated to reimagining how statistics should be taught in the undergraduate curriculum. The editors noted:
“We hope that this collection of articles as well as the online discussion provide useful fodder for further review, assessment, and continuous improvement of the undergraduate statistics curriculum that will allow the next generation to take a leadership role by making decisions using data in the increasingly complex world that they will inhabit.”I am confident that my book will do its small part in equipping the next generation of students with the kind of skills needed to succeed in a data-centric world. For one, I have taken a storytelling approach to statistics. This book reinforces the point that data science and analytics training should be applied rather than theoretical, and the ultimate purpose of producing or consuming statistical analysis is to tell fascinating stories from it. Therefore, the book opens with the chapter titled, The Bazaar of Storytellers.
Who is this book for?
While the world is awash with large volumes of data, inexpensive computing power, and vast amounts of digital storage, the skilled workforce capable of analyzing data and interpreting it is in short supply. A 2011 McKinsey Global Institute report suggests that “the United States alone faces a shortage of 140,000 to 190,000 people with analytical expertise and 1.5 million managers and analysts with the skills to understand and make decisions based on the analysis of big data.”Getting Started with Data Science (GSDS) is a purpose-written book targeted at those professionals who are tasked with analytics, but they do not have the comfort level needed to be proficient in data-driven analytics. GSDS appeals to those students who are frustrated with the impractical nature of the prescribed textbooks and are looking for an affordable text to serve as a long-term reference. GSDS embraces the 24-7 streaming of data and is structured for those users who have access to data and software of their choice, but do not know what methods to use, how to interpret the results, and most importantly how to communicate findings as reports and presentations in print or on-line.
GSDS is a resource for millions employed in knowledge-driven industries where workers are increasingly expected to facilitate smart decision-making using up-to-date information that sometimes takes the form of continuously updating data.
At the same time, the learning-by-doing approach in the book is equally suited for independent study by senior undergraduate and graduate students who are expected to conduct independent research for their coursework or dissertations.
Praise for the book
I am also pleased to share with you the praise for my book by Dr. Munir Sheikh, Canada’s former chief statistician:“The power of data, evidence, and analytics in improving decision-making for individuals, businesses, and governments is well known and well documented. However, there is a huge gap in the availability of material for those who should use data, evidence, and analytics but do not know how. This fascinating book plugs this gap, and I highly recommend it to those who know this field and those who want to learn.”— Munir A. Sheikh, Ph.D., Distinguished Fellow and Adjunct Professor at Queen’s University
Tom Davenport, author of the bestselling books Competing on Analytics and Big Data @ Work.has the following to say about my book:
“A coauthor and I once wrote that data scientists held ‘the sexiest job of the 21st century.’ This was not because of their inherent sex appeal, but because of their scarcity and value to organizations. This book may reduce the scarcity of data scientists, but it will certainly increase their value. It teaches many things, but most importantly it teaches how to tell a story with data.”—Thomas H. Davenport, Distinguished Professor, Babson College; Research Fellow, MIT.
Dr. Patrick Surry, Chief Data Scientist at www.Hopper.com had the following to say:
“This book addresses the key challenge facing data science today, that of bridging the gap between analytics and business value. Too many writers dive immediately into the details of specific statistical methods or technologies, without focusing on this bigger picture. In contrast, Haider identifies the central role of narrative in delivering real value from big data.And finally, Professor Atif Mian, author of the best-selling book: The House of Debt offered the following assessment:
“The successful data scientist has the ability to translate between business goals and statistical approaches, identify appropriate deliverables, and communicate them in a compelling and comprehensible way that drives meaningful action. To paraphrase Tukey, ‘Far better an approximate answer to the right question, than an exact answer to a wrong one.’ Haider’s book never loses sight of this central tenet and uses many realworld examples to guide the reader through the broad range of skills, techniques, and tools needed to succeed in practical data-science. “Highly recommended to anyone looking to get started or broaden their skillset in this fast-growing field.”
“We have produced more data in the last two years than all of human history combined. Whether you are in business, government, academia, or journalism, the future belongs to those who can analyze these data intelligently. This book is a superb introduction to data analytics, a must-read for anyone contemplating how to integrate big data into their everyday decision making.”— Professor Atif Mian, Theodore A. Wells ’29 Professor of Economics and Public Affairs,
Princeton University; Director of the Julis-Rabinowitz Center for Public Policy and Finance at the Woodrow Wilson School.
Sunday, December 6, 2015
Not so sweet sixteen!
If you happen to use Microsoft Excel for running Regressions, you will soon realize your limits: The Windows version of Excel 2013 permits no more than 16 explanatory variables.
Excel has made great progress in expanding its capabilities in the recent past. Unlike the few thousand rows in the past, the current version permits about a million rows per Sheet (a single data set). But when it comes to regression, you may have several thousand observations in the data set, you are still limited by a hard constraint of sixteen explanatory variables.
Some would argue that for parsimony, we should be content with the restriction. True, but with categorical variables, the number of explanatory variables stretch beyond the artificial constraints set by Microsoft Excel.
Others might inquire why do statistical analyses in Excel in the first place. Despite the inherent limitations in Microsoft Excel, business schools in particular and other social science undergraduate programs in general, are increasingly turning to Excel to teach courses in statistics. If you were to take a quick look at the curriculum of the undergraduate business and numerous MBA programs, you would realize how widespread is the use of Excel for courses in statistics and analytics.
At Ryerson University, I switched to R years ago for my MBA courses. Thanks to John Fox’s R Commander, the transition to R was without much hassle. The students were told in the very beginning that they were now part of the big league, and hiding behind spreadsheets was no longer an option.
I must mention that Microsoft Excel continues to be my platform of choice for a variety of tasks. I use Excel several times a day, but not for statistical analysis. I am not suggesting that Excel cannot do statistics; I am arguing that it can do a much better job of it.
As I see it, Microsoft has several options. First is do nothing. After all, Microsoft Excel has no real competition in the Windows environment. Second, it could turn to the team that has programmed the linest function in Excel and ask them to add some muscle to it. That will be the wrong approach.
Instead, Microsoft should explore ways to integrate R or another freeware with Excel to add a complete analytics menu. Microsoft should learn from what the leaders in analytics are already doing. SPSS, an industry leader in analytics category, has already integrated R, allowing the SPSS users to merge the robust data management strengths of SPSS with the state-of-the-art analytics bundled with R. SAS, another big name in analytics, is about to do the same.
And since Microsoft has recently acquired Revolution R, it makes even more sense to build a bridge between Excel and Revolution R Open (RRO).
R Through Excel is one example of integrating R with Excel. If Microsoft were to put its weight behind the initiative, it could build a seamless coupling with R expanding the analytic capabilities for hundreds of million Excel users.
As for the SPSS, I recommend they also consider another option. If Microsoft were to integrate RRO with Excel, they could acquire an advanced analytics software and integrate it with SPSS. For this option, I would recommend Limdep, which I have found to be the most diverse software for statistical analysis and econometrics. Even though R is a collective effort of thousands of software developers, Limdep offers numerous routines and post-estimation options that are not available in the thousands of R packages. SPSS integrated with Limdep could become the most diversely capable commercial software in the market as it will bridge the gap with SAS and Stata.
As for the colleagues in business faculties pondering over what platform to adopt for the analytics/software courses, I would say know your limits, especially with Microsoft Excel while deciding upon the curriculum.
Friday, October 30, 2015
Curious about big data in Montreal?
www.BigDataUniversity.com, which is an IBM-led initiative is running meetups across North America to create awareness about, and training in, big data analytics.
BigDataUniversity runs MOOCs and through its online data scientist workbench provides access to python, R, and even Spark. Also, you can learn about Watson Analytics and see how you can work with the state-of-the-art in computing.
Further details are available at:
Getting started with Data Science and Introduction to Watson Analytics
http://www.meetup.com/YUL-Social-Mobile-Analytics-Cloud-Meetup/Thursday, April 9, 2015
Stata embraces Bayesian statistics
Of course R already offered numerous options for Bayesian Inference. It will be interesting to hear from colleagues proficient in Bayesian statistics to compare Stata’s newly added functionality with what has already been available from R.
Given the hype with big data and the newly generated demand for data mining and advanced analytics, it would have been timely for Stata to also add data mining and machine learning algorithms. My two cents: data mining algorithms are in greater demand than Bayesian statistics. Stata users will have to wait for a year or more to see such capabilities. In the meanwhile, R offers several options for data mining and machine learning algorithms.
Monday, November 3, 2014
R: What to do when help doesn't arrive
I am not suggesting that the package authors should respond to every email that they receive. My request is that the documentation should be complete enough so that the authors’ help is no longer required on a day-to-day basis.
Recently, a colleague in the US and I became interested in the mlogit package. We wanted to use the weights option in the package. Just like most other packages, mlogit does not illustrate how to use weights, but advises that the option is available. We assumed that the weights would work in a certain way (see page 26 of the hyperlinked document). However, when I estimated the model with weights, mlogit did not replicate the results from a popular textbook on econometrics. Here are the details.
We wanted to see if the the weights option could be used in an alternative specific logit formulation when the sampled data do not conform to the market shares observed in the underlying population? For instance, in a travel choice model, one may be tempted to over sample train commuters and under-sample car commuters because often car commuters far outnumber the train commuters for inter-city travel in the underlying population. This is true for most of Canada and the US. In such circumstances, we would weight the data set so that the estimated model reproduces the population market shares rather than the sample shares.
The commercially available software, NLogit/LimDep can do this with ease. I wanted to replicate the results for choice-based weights for the conditional logit model in Professor Bill Greene's book, Econometric Analysis. This is illustrated on page 853 of the 6th edition of the text where Table 23.24 presents the parameter estimates for a conditional (McFadden) logit model for the un-weighted and the choice-based weighted versions. I replicated the results using NLogit with a simple addition of population market shares in the two-line syntax. However, the results generated by mlogit package bear no resemblance to the ones listed in Econometric Analysis.
It turns out that Stata is also limited in the way it handles weights for the two estimation options: asclogit and clogit. I know this because colleagues at Stata were quite diligent in responding to my requests. It’s not the same with the mlogit, which may or may not be able to handle the weights. We will only know when the author responds.
I am recommending that it should not be left to the individual authors to bear the sole responsibility for supporting the R packages. The individual could be ill, busy, or unavailable for a variety of reasons. This limitation could be proactively dealt with if the R community collectively generates help documentation by detailed worked-out examples of all available options (including weights), and not the few frequently used ones.
Improving documentation will be key to helping R branch out to the everyday users of statistical analysis. The tech-savvy can iron out the kinks. They have the curiosity, patience, and time on their hand. The rest of the world is not that fortunate.
I propose that users of the packages, and not just the authors, should collaborate to generate help documentation as vignettes and YouTube videos. This will do more in popularizing R than another 6,000 new packages that few may know how to work with.
Sunday, December 8, 2013
Comparing mnlogit and mlogit for discrete choice models
Earlier this weekend (Dec. 7, 2013), mnlogit was released on CRAN by Wang Zhiyu and Asad Hasan (asad.hasan@sentrana.com) claiming that mnlogit uses “parallel C++ library to achieve fast computation of Hessian matrices”.
Here is a comparison of mnlogit with mlogit by Yves Croissant whose package seems to be the inspiration for mnlogit.
I will estimate the same model using the same data set and will compare the two packages for execution speed, specification flexibility, and ease of use.
Data set
I use the Fish data set to estimate mnlogit and mlogit. mnlogit defines the data set as follows:
A data frame containing :
- mode - The choice set: beach, pier, boat, and charter
- price - price for a mode for an individual
- catch - fish catch rate for a mode for an individual
- income - monthly income of the individual decision-maker
- chid - decision maker ID
The authors mention that they have sourced the data from R package mlogit by Yves Croissant, which lists the source as:
- Herriges, J. A. and C. L. Kling (1999) “Nonlinear Income Effects in Random Utility Models”, Review of Economics and Statistics, 81, 62-72.
Estimation with mnlogit
library(mnlogit)
## Warning: package 'mnlogit' was built under R version 3.0.2
## Package: mnlogit Version: 1.0 Multinomial Logit Choice Models. Scientific
## Computing Group, Sentrana Inc, 2013.
data(Fish, package = "mnlogit")
fm <- formula(mode ~ 1 | income | price + catch)
summary(mnlogit(fm, Fish, "alt"))
##
## Call:
## mnlogit(formula = fm, data = Fish, choiceVar = "alt")
##
## Frequencies of alternatives in input data:
## beach boat charter pier
## 0.113 0.354 0.382 0.151
##
## Number of observations in training data = 1182
## Number of alternatives = 4
## Intercept turned: ON.
## Number of parameters in model = 14
## # individual specific variables = 2
## # choice specific coeff variables = 2
## # generic coeff variables = 0
##
## Maximum likelihood estimation using Newton-Raphson iterations.
## Number of iterations: 7
## Number of linesearch iterations: 7
## At termination:
## Gradient 2-norm = 8.19688645245397e-05
## Diff between last 2 loglik values = 4.15543581766542e-08
## Stopping reason: Succesive loglik difference < ftol (1e-06).
## Total estimation time (sec): 0.04
## Time for Hessian calculations (sec): 0.04 using 1 processors.
##
## Coefficients :
## Estimate Std.Error t-value Pr(>|t|)
## (Intercept):boat 8.64e-01 3.15e-01 2.74 0.00607 **
## (Intercept):charter 1.85e+00 3.10e-01 5.97 2.4e-09 ***
## (Intercept):pier 1.13e+00 3.05e-01 3.71 0.00021 ***
## income:boat -1.10e-04 6.02e-05 -1.84 0.06636 .
## income:charter -2.78e-04 6.03e-05 -4.61 4.0e-06 ***
## income:pier -1.28e-04 5.33e-05 -2.41 0.01605 *
## price:beach -3.80e-02 3.33e-03 -11.41 < 2e-16 ***
## price:boat -2.09e-02 2.23e-03 -9.33 < 2e-16 ***
## price:charter -1.60e-02 2.02e-03 -7.94 2.0e-15 ***
## price:pier -3.92e-02 3.26e-03 -12.02 < 2e-16 ***
## catch:beach 4.95e+00 8.20e-01 6.04 1.5e-09 ***
## catch:boat 2.47e+00 5.19e-01 4.76 1.9e-06 ***
## catch:charter 7.61e-01 1.52e-01 4.99 6.0e-07 ***
## catch:pier 4.88e+00 8.99e-01 5.43 5.5e-08 ***
## ---
## Signif. codes: 0 '***' 0.001 '**' 0.01 '*' 0.05 '.' 0.1 ' ' 1
##
## Log-Likelihood: -1160, df = 14
## AIC: 13.8875709217033
system.time((mnlogit(fm, Fish, "alt")))
## user system elapsed
## 0.11 0.00 0.11
Estimation with mlogit
I estimate the same model using mlogit.
library(mlogit)
## Loading required package: Formula Loading required package: statmod
## Loading required package: lmtest Loading required package: zoo
##
## Attaching package: 'zoo'
##
## The following object is masked from 'package:base':
##
## as.Date, as.Date.numeric
##
## Loading required package: maxLik Loading required package: miscTools
## Loading required package: MASS
data2 <- mlogit.data(Fish, choice = "alt", shape = "long", id.var = "chid",
alt.levels = c("beach", "boat", "charter", "pier"))
summary(mod1 <- mlogit(mode ~ 1 | income | price + catch, data2, reflevel = "beach"))
##
## Call:
## mlogit(formula = mode ~ 1 | income | price + catch, data = data2,
## reflevel = "beach", method = "nr", print.level = 0)
##
## Frequencies of alternatives:
## beach boat charter pier
## 0.113 0.354 0.382 0.151
##
## nr method
## 7 iterations, 0h:0m:0s
## g'(-H)^-1g = 8.31E-08
## gradient close to zero
##
## Coefficients :
## Estimate Std. Error t-value Pr(>|t|)
## boat:(intercept) 8.64e-01 3.15e-01 2.74 0.00607 **
## charter:(intercept) 1.85e+00 3.10e-01 5.97 2.4e-09 ***
## pier:(intercept) 1.13e+00 3.05e-01 3.71 0.00021 ***
## boat:income -1.10e-04 6.02e-05 -1.84 0.06636 .
## charter:income -2.78e-04 6.03e-05 -4.61 4.0e-06 ***
## pier:income -1.28e-04 5.33e-05 -2.41 0.01605 *
## beach:price -3.80e-02 3.33e-03 -11.41 < 2e-16 ***
## boat:price -2.09e-02 2.23e-03 -9.33 < 2e-16 ***
## charter:price -1.60e-02 2.02e-03 -7.94 2.0e-15 ***
## pier:price -3.92e-02 3.26e-03 -12.02 < 2e-16 ***
## beach:catch 4.95e+00 8.20e-01 6.04 1.5e-09 ***
## boat:catch 2.47e+00 5.19e-01 4.76 1.9e-06 ***
## charter:catch 7.61e-01 1.52e-01 4.99 6.0e-07 ***
## pier:catch 4.88e+00 8.99e-01 5.43 5.5e-08 ***
## ---
## Signif. codes: 0 '***' 0.001 '**' 0.01 '*' 0.05 '.' 0.1 ' ' 1
##
## Log-Likelihood: -1160
## McFadden R^2: 0.225
## Likelihood ratio test : chisq = 675 (p.value = <2e-16)
system.time(mlogit(mode ~ 1 | income | price + catch, data2, reflevel = "beach"))
## user system elapsed
## 0.27 0.02 0.28
Speed Tests
I conducted a simple test for execution times with the command system.time. The results are reported above after each model summary.
Findings
Final comment
I am delighted to see yet another package for discrete choice models. As the field evolves and more advanced problems are subjected to discrete choice models, the need for robust and computationally efficient packages will be felt more. Both mlogit and mnlogit are indeed valuable to those interested in how humans make good and bad choices!
Tuesday, June 26, 2012
Workshop on Structural Equation Models

The Ted Rogers School of Management at Ryerson University is offering a one-day, hands–on workshop on Structural Equation Modelling. The workshop focuses on SEM theory and applications using R and Amos.
Instructors: Professor Richard Michon and Christine Buske
When: July 11, 2012 (8:30 to 3:30 pm)
Where: TRS 3-099 (55 Dundas Street West, 9th floor)
RSVP: Christine Buske (chr.buske@ryerson.ca)
Monday, January 16, 2012
Forecaster of the year loses his job
Jim O’Sullivan is ranked the top forecaster of the year. He is credited with outperforming the consensus forecasts of other leading economists. However, the economic downturn sank his employer and Jim lost his job like the rest of the employees of MF Global Inc.
“When forecasting the data, in the end we are just trying to be the least inaccurate among our peers,” O’Sullivan said. No one can get them all, he admits. But he still tries to beat the consensus on every number he forecasts. “It is do-able if you do the homework, if you combine econometrics with judgment borne of experience.”
Read more at Marketwatch.com.
Forecasters of the year
2004 Maury Harris & Jim O'Sullivan, UBS
2005 Brian Jones, Citigroup
2006 Maury Harris & Jim O'Sullivan, UBS
2007 Stephen Stanley, RBS Greenwich Capital
2008 Maury Harris & Jim O'Sullivan, UBS
2009 Nigel Gault & Brian Bethune, IHS Global Insight
2010 Spencer Staples, EconAlpha
2011 Jim O'Sullivan, MF Global
Saturday, January 14, 2012
Big media waking up to big data
A recent Globe and Mail column points out that by 2018 in the United States alone there will be a shortfall of 190,000 specialists with deep analytical talent. It is good to see that the mainstream media is waking up to the need for applied training in data analytics.
At the management faculty at Ryerson University in Toronto, we have risen to the challenge by teaching the state of the art in business and data analytics to ensure that our graduates could stay ahead of the curve. For instance, we have replaced the conventional stats software with R, which is the analytic tool of choice of quants, statisticians, and analysts For details, visit:
- Applied Retail Research (Click HERE)
- Research and Communication for Managers (Click HERE)
“The lovely jobs are why we should all enroll our children immediately in statistics courses. Big data can only be unlocked by shamans with tremendous mathematical aptitude and training. McKinsey estimates that by 2018 in the United States alone, there will be a shortfall of between 140,000 and 190,000 graduates with “deep analytical talent.” If you are one of them, you will surely have a “lovely” well-paying job.”
The Globe and Mail, January 12, 2012
Wednesday, June 29, 2011
Stata 12 embraces structural equation models
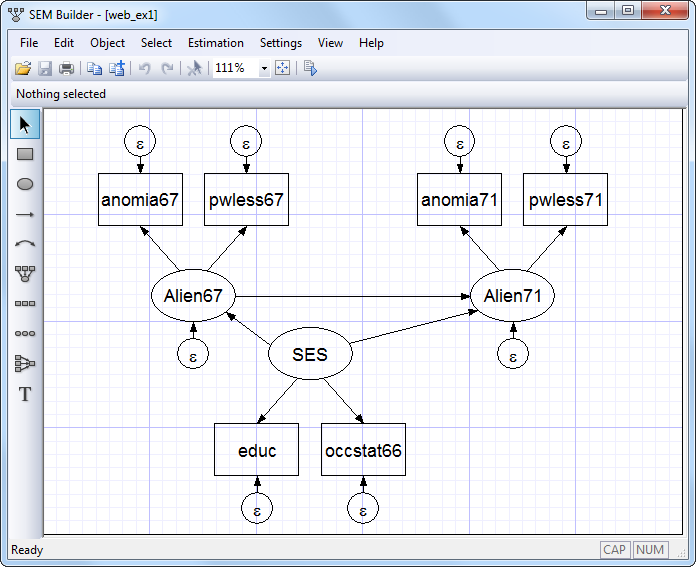
LISREL and AMOS have been the two most commonly used software to estimate SEM. Professor John Fox authored an R package, sem, which allows R users to estimate the basic SEM. Professor Fox used Wheaton, Muthén, Alwin, and Summers’s (1977) panel data to illustrate estimation of SEM. Stata 12 also illustrates SEM using the same data set.
Stata 12, according to Stata's website, supports the following in SEM:
- Use GUI or command language to specify model.
- Standardized and unstandardized results.
- Direct and indirect effects.
- Goodness-of-fit statistics.
- Tests for omitted paths and tests of model simplification including modification indices, score tests, and Wald tests.
- Predicted values and factor scores.
- Linear and nonlinear (1) tests of estimated parameters and (2) combinations of estimated parameters with CIs.
- Estimation across groups is as easy as adding group(sex) to the command. Test for group invariance. Easily add or relax constraints across groups.
- SEMs may be fitted using raw or summary statistics data.
- Maximum likelihood (ML) and asymptotic distribution free (ADF) estimation. ADF is also known as generalized method of moments (GMM). Missing at random (MAR) data supported via FIML.
- Robust estimate of standard errors and standard errors for clustered samples available.
- Support for survey data including sampling weights, stratification and poststratification, and clustered sampling at one or more levels.
Sunday, April 17, 2011
Going over the speed limit
In an earlier post [Speeding tickets for R and Stata] I had reported on how R compared with Stata for executing algorithms involving maximum likelihood estimation. This post offers the following updates on the last post:
My data set (used for the test results reported below) comprised an ordinal dependant variable [5 categories] and categorical explanatory variables with 63,122 observations. I used a computer running Windows 7 Professional on Intel Core 2 Quad CPU Q9300 @ 2.5 GHz with 8 GB of RAM. Further details about the tests are listed in the following Table.
| Software Routines | Stata 11 (duo core) | R (2.12.0) [32-bit] | R x64 2.13.0 | NLogit/Limdep |
| Commercial license price | US$2,495 | Free | Free | $1,395 |
| Multinomial Logit | mlogit, 9.06 seconds (2.89 seconds with the “quietly” option") | multinom, 50.59 sec + 52.29 sec zelig (mlogit), 77.89 sec VGLM (multinomial), 64.4 sec | multinom, 32.7 sec + 49.8 sec zelig (mlogit), 69.92 sec VGLM (multinomial), 63.76 sec | Logit; 36.72 sec |
| Proportional odds model | ologit, 1.69 sec 0.91 sec [quietly] oprobit, 0.91 sec [quietly] | VGLM (parallel = T), 16.26 sec polr, 22.62 sec [o.logit] | VGLM (parallel = T), 14.94 sec polr, 13.49 sec [o.logit] polr, 14.94 sec [o.probit] | Ordered [Logit] 18.50 sec Ordered [Probit] 36.33 sec |
| Generalized Logit | gologit2, 18.67 sec (15.1 seconds with the “quietly” option") | VGLM (parallel = F), 64.71 sec | VGLM (parallel = F), 64.86 sec |
Stata is even faster
When I reran the models using the quietly option (which supresses terminal output ) in Stata, I obtained the actual algorithm convergence times. For the multinomial logit model, Stata took fewer than 3 seconds to converge, making it 10-times faster than R. Similar reductions in execution times for Stata were observed for other algorithms reported in the table above.
64-bit version of R is faster, sometimes
The 64-bit version of R (2.13.0) reported faster execution times. The same was observed for the 64-bit version of R (2.12.0). Notice in the table above the dramatic reduction in the convergence times for the multinomial logit model (using multinom). R 2.13.0 [64-bit] took 35.4% less time to converge than R 2.12.0 [32-bit]. However, Zelig and VGLM based algorithms reported very modest improvements in execution times.
The ordered logit and ordered probit models (executed using the polr algorithm) also reported significant improvements in execution times.The ordered logit model took 40.3% less time in converging for R 2.13.0 [64-bit] than R 2.12.0 [32-bit].
I still do not understand why the summary(multinomial logit model) still takes an additional 49.8 seconds on top of 32.7 seconds to report summary results for the multinomial logit model. When I do not use summary() and instead use coef(multinomial logit model), I get instantaneous output.
In summary, it appears that not all algorithms would converge faster in the updated 64-bit version of R 2.13.0.
R is faster than Limdep/NLogit
In comparison, R [2.13.0] offered faster convergence times than NLogit for multinomial and ordered logit models and for ordered probit models. This puts R in the middle of two popular econometrics software. Stata is significantly faster than R, and R offers faster execution times than NLogit (see the difference for ordered logit in the table above).
What R Pros are saying about my post
If you were to scroll down to the comments section of my last post [Speeding tickets for R and Stata], you’ll notice some advice from experienced users of R. I have been advised to re-run the tests by first obtaining the optimised version of BLAS and LAPACK libraries. I am not sure how much difference would that make. However, it would be a little difficult for ordinary users of R (such as myself) to be able to determine what BLAS and LAPACK libraries to choose and install that are appropriate for their computer systems.
If significant speed gains could be achieved by using optimised BLAS and LAPACK libraries, the R installation routines may then be improved so that these libraries are made available to the novice end users of R.
Monday, April 11, 2011
Speeding tickets for R and Stata
How fast is R? Is it as fast in executing routines as the other off-the-shelf software, such as Stata? After some comparative experimentation, I found Stata to be 5 to 8 times faster than R.
For me, speed has not been a concern in the past. I had used R with smaller datasets of roughly 5000 to 10,000 observations and found it to be as fast as other statistical software. More recently, I have been working with still a relatively small-sized data set of 63,122 observations. After realizing that R was very slow in executing the built-in routines for multinomial and ordinal logit models, I ran similar models in Stata with the same data set and found Stata to be much faster than R.
Before I go any further, I must confess that I did not try to determine ways to improve speed in R by, for instance, choosing faster converging algorithms. I hope readers would send me comments on how to speed-up execution for the routines I tested in R.
My data set comprised an ordinal dependant variable [5 categories] and categorical explanatory variables with 63,122 observations. I used a computer running Windows 7 on Intel Core 2 Quad CPU Q9300 @ 2.5 GHz with 8 GB of RAM. Further details about the test are listed in the following Table.
Software Routine | Stata 11 (duo core) | R (2.12.0) |
| Multinomial Logit | mlogit, 9.06 seconds | multinom, 50.59 seconds zelig (mlogit), 77.89 sec VGLM (multinomial), 64.4 sec |
| Proportional odds model | ologit, 1.69 sec | VGLM (parallel = T), 16.26 sec polr, 22.62 seconds |
| Generalized Logit | gologit2, 18.67 sec | VGLM (parallel = F), 64.71 sec |
I first estimated the standard multinomial logit model in R using the multinom routine. R took almost 51 seconds to return the results. The subsequent call to summarise the model took another 52.29 seconds, thus making the total execution time in R to be 103 seconds. Surprised at the slow speed, I tried other options in R to estimate the same model. I first tested mlogit option in Zelig. The execution time was even slower at 78 seconds. I followed up with VGAM package, which returned a slightly better result with 64.4 seconds.
Other examples listed above suggest similar slower times for R in comparison with Stata.
What could be the reason for such an order of magnitude difference in speed between R and Stata. I unfortunately don’t have the answer. I do know that Revolution Analytics offers similar performance benchmark comparisons between their version of souped-up R (Revolution R) and the generic R. Revolution R was found to be five to eight times faster than regular R.
Other performance benchmarks revealed even greater speed differentials between Revolution R and the generic R.
There must be ways to make routines execute faster in R. A few weeks earlier, Professor John Fox ( a long-time contributor to R and the programmer of the R GUI, R Commander) delivered a guest lecture at the Ted Rogers School of Management in Toronto at the GTA R Users’ Group meeting. His talk focussed on how to program using binary logit model as an example. His code for binary logit was found to be much faster than the one that comes bundled with the GLM in R.
This makes me wonder: are there ways to make the generic R run faster?
Monday, November 29, 2010
SPSS Guru embraces the freeware, R
From Forbes:
Power in the Numbers
Quentin Hardy, 05.24.10, 12:00 AM ETWe clock up more new data every couple of weeks than humanity made from its start until the year 2000. This mass of data promises freedom, efficiency and power to the societies that know how to manipulate it. Norman Nie taught us how to manipulate data.
While a newly minted political science Ph.D. in 1968, Nie co-invented the Statistical Package for Social Sciences. Along with innovations from a few other pioneers like the SAS Institute, it marked the birth of analytic and predictive statistical software, stuff that tells corporations how to make, price and sell things. Now 67, Nie is championing a new style of fast and cheap prediction analytics that will give statistical tools to laymen, just as word processors made us all publishers and YouTube made us all film producers.
"We are at the beginning of a process that will change the nation-state," he says. "People will look at reactions to a product or a policy in ways never before known. It could mean highly empowered individuals or better manipulation and control." Either way, he figures, we need to get smart about it.
Statistics is a science of comparatively recent invention, beginning in the 17th century with analysis of gamblers' odds and flowering in the early 20th with tools for averaging, weighing and guessing. The human brain is a statistical manipulator in that it detects patterns and likelihoods from a large collection of observations. You might decide whether to eat at a new restaurant by judging factors like how crowded it is, whether there is a maitre d', whether you've liked that type of food before. What our brains do with a hunch, computers do by looking at data points, sometimes trillions of them.
Nie's SPSS started out as an academic exercise and soon became a serious business (one that IBM bought for $1.2 billion last summer, two years after Nie left). It's a collection of software programs that let experts quickly detect patterns and thus make predictions, whether of how pricing affects Mother's Day Internet flower sales or how demographic changes determine the number of prisons needed.
Combine that commercial success with the open-source software movement and you have a new company, Revolution Analytics. The firm, which was founded in 2007 in Palo Alto, Calif., now has around 30 employees.
Revolution takes as its starting point the statistical programming language R, a freebie invented in 1993 by some academics in New Zealand and since then enriched by many volunteers. The public-domain library of R software numbers 2,500 routines.
Using an R package originally for ecological science, a human rights group called Benetech was able to establish a pattern of genocide in Guatemala. A baseball fan in West Virginia used another R package to predict when pitchers would get tired, winning himself a job with the Tampa Bay Rays. An R promoter in San Francisco, Michael Driscoll, used it to prove that you are seven times as likely to change cellphone providers the month after a friend does. Now he uses it for the pricing and placement of Internet ads, looking at 100,000 variables a second.
R is a powerful tool but difficult for novices to use. Nie's Revolution Analytics aims to make it more accessible with a better-organized library, capabilities for bigger jobs and a user interface that lets users drag and drop statistical analyses into place, outputting easily read charts. Revolution offers a free stripped-down version for academia and a deluxe version for business, which Nie says will undercut SPSS' and SAS' prices by 80%. Revolution has won customers like Pfizer, Yale Cancer Center, Bank of America and Motorola.
Nie may even hope to do some good. He got rich from SPSS but remained an academic at both the University of Chicago and Stanford. An early book, The Changing American Voter, used statistical analysis to display a growing sophistication and tolerance among the electorate. A later volume, Education and Democratic Citizenship in America, charted how our more educated population was more tolerant of difference but not more participatory in government.
Nie thinks his own creation has played a role in a current problem in America, the rise of extremes in political parties. These days, he says, cheaper publishing technologies and, yes, sharper statistical analysis have given us a more riven politics.
"Polling has been a blessing because you can find out what people really want," he says, "but you change the standard deviation around the middle when you can slice and dice more and more. ... Technologies are more efficient, but they seem to pull apart society, identifying the most ideologically active."
The primary system was supposed to take power from the special interests in smoky rooms but created low-participation polls that attracted zealots on both sides of the aisle who could be found using social science statistics. They elected candidates as extreme as themselves. Between those two factors, says Nie, "we are in deep trouble."
His answer: Change politics further with R-powered statistics. Nie posits that statisticians can act as watchdogs for the common man, helping people find new ways to unite and escape top-down manipulation from governments, media or big business.
"Everyone can, with open-source R, afford to know exactly the value of their house, their automobile, their spouse and their children--negative and positive," he says, presumably joking about the last bits. "It's a great power equalizer, a Magna Carta for the devolution of analytic rights."
He is also a realist and says the opposite could also happen, particularly as more and more of what we do and say is captured as statistical phenomena. "The customer pressure on business has never been better, but knowledge of manipulation and control has never been better, either," he says.
Predictably, both SAS and IBM have taken steps to accommodate R and posit themselves in the middle of the predictive analytics revolution. IBM says that algorithms written in R will be accessible in their system, and SAS is making room for R results to be displayed in its technology. "The more perspectives you have on analysis, the better," says Anne Milley, a senior director at SAS. "Science used to be considered deterministic, but we live in a probabilistic world."
Nie may also take flak from R's open-source community, which includes plenty of fanatics who think software wants to be free. Says R co-inventor Robert Gentleman, who sits on the Revolution Analytics board: "If he comes out saying that he's better and faster, he's just going to annoy people."
Nie grew up in St. Louis, dropping out of high school to go to Mexico, where he became a published fiction writer while in his teens. He came home to take a degree in sociology and political science at Washington University in St. Louis. His Ph.D. dissertation at Stanford involved heterogeneous data from seven different countries.
"There was no way I could get through all of that by hand," Nie says. "I had to figure out a way to program for statistical procedures." Working with Hadlai (Tex) Hull, a recent M.B.A., and Dale H. Bent, a doctoral candidate in operations research, he developed SPSS as a shortcut to crunching different types of data. SPSS quickly caught on, and people began asking if they could use it on their university's computers. The developers figured they could sell tapes of the code for $400, about what a junior professor could pay without departmental permission.
Nie went to the University of Chicago in 1969 and continued working with Hull on developing SPSS. In 1973 the Internal Revenue Service told Chicago it had a profitmaking company inside the school, and Nie was advised to take a year off to develop his project. SPSS was incorporated in 1975, with no venture capital or financial backing but strong ties to academic buyers. Nie and Hull shared ownership after buying out Bent, who returned to Canada.
It is all in the rearview mirror. "R is an absolutely massive advancement on the kind of analytics I invented," he says. "It's an opportunity to change the game in the fastest-growing field in software."
Nie is working on a new book about great disruptive technologies in history: the printing press, the cotton gin, birth control pills, the Internet. Analysis software, he feels, will change the world again, likely in ways we still do not understand.
Across the street from Revolution's office, Stanford offers a graduate course titled "The Elements of Statistical Learning," whose 700-page textbook is dominated by R functions. Many of its graduates are building social sites like Facebook and Twitter.
"Large corporations creating data, people in international social groups, Internet translation of languages--it erodes national boundaries," Nie says. "What's all this mean--highly empowered individuals or better control? It does possibly create a more anarchical and unethical world. Maybe business can't be observed as much, but maybe it can be observed better. All technologies are two-edged blades."
Thursday, July 29, 2010
From Coats to Sheikh
Last week Dr. Munir Sheikh resigned as Statistics Canada’s chief statistician to register his protest at the government’s attempt to misrepresent the agency about its views on converting the mandatory census into a voluntary one.
Dr. Sheikh told the parliamentary industry committee that the “fact that in the media and in the public that there was this perception that Statistics Canada was supporting a decision that no statistician would, it really casts doubt on the integrity of that agency, and I as head of that agency cannot survive in that job."
It is only appropriate to remember Robert H. Coats who was the first chief statistician of Canada who laid the foundation of Statistics Canada after being appointed as the Controller of Census in 1915.
Wikipedia recalls Robert Coats as follows:
Robert Hamilton Coats (July 25, 1874 – February 7, 1960) was Canada's first Dominion Statistician.
He was born in Clinton, Huron County, Ontario in 1874, the son of Charles Coats, who came to Canada from Scotland. In 1896, Coats received a B.A. from the University College in Toronto. He worked as a journalist for the Toronto World and then the Toronto Globe until 1902 when, at the request of Prime Minister Mackenzie King, he became editor of the Labour Gazette; King himself had been the first editor of this publication which included statistical information related to labour. Coats was named Chief Statistician for the Department of Labour in 1905. In 1915, he was appointed Dominion Statistician and Controller of the Census. Coats helped establish the Dominion Bureau of Statistics, now Statistics Canada.
He also served on statistical committees with the League of Nations. After he retired in 1942, Coats served as statistical advisor to the government of Ontario and the United Nations. He served four years as visiting professor of statistics in the Department of Political Economy at the University of Toronto.
Coats, one of the first residents of Rockliffe Park, died in Ottawa at the age of 85. He had been married twice, first to Marie Hollbeister, and then, after his first wife's death, to Maida Skelly.
The R.H. Coats Building in Ottawa was named after him.
References
- Robert Hamilton Coats fonds, Archives Canada
- Herbert Marshall, The Canadian Journal of Economics and Political Science / Revue canadienne d'Economique et de Science politique, Vol. 26, No. 3. (Aug., 1960), pp. 482-483.
- John A. Stevenson, The American Statistician, Vol. 14, No. 2. (Apr., 1960), pp. 28-29.
Related articles by Zemanta
- Munir Sheikh shows us what integrity and leadership look like (theglobeandmail.com)
- Ex-StatsCan head defends mandatory census (cbc.ca)
- Statistics Canada, Dr. Munir Sheikh, and the long form (ekonometrics.blogspot.com)