Tuesday, April 27, 2010

WSJ up NY Times down

The latest figures released by the Audit Bureau of Circulations reveal that the Wall Street Journal has become the largest weekday paper in the United States with a week-day circulation of 2.092 million copies. The USA Today came second with 1.83 million copies. The New York Times with 0.95 million week-day copies was third. NY Times, however, continues to dominate the weekend sales.

WSJ was the only large paper that reported an increase in circulation over the past six months. 

The web-based circulation, however, paints a different picture. According to Google data, New York Times  with 4 million daily visitors to its website is far ahead of its rivals.

image

Sunday, April 25, 2010

The decline of the Creative Class

Richard Florida’s pop economics worked well in the boom times. He credited the creative class (any one sitting behind a computer or an easel at work) for bringing us wealth and prosperity.

When the housing prices and CEO compensations were growing, Richard Florida’s theories seemed the answer for all our economic ills. His solution: we should turn the manufacturing and agrarian classes into the creative class; replace shovels with Adobe Photoshops, and you are set for prosperity.

The test of any economic theory or paradigm is it’s ability to withstand a (great) recession. The creative class, it appears, did not fare well during recession in the United States. The map below presents the change in personal income during 2007-08 in the United States. The blue-coloured counties are the ones with highest income gains and the yellow-coloured are the ones with the lowest income gains. Florida’s creative classes are mostly in yellow, with lowest income gains.

image

Source: http://www.bea.gov/newsreleases/regional/lapi/2010/lapi0410.htm

The highest gains were reported for counties with agricultural economic base. After years of declining farm incomes, agri-based counties saw a resurgent in their incomes in 2009. According to BEA:

For the nation, personal income grew 2.9 percent in 2008 after growing 5.5 percent in 2007. A surge in farm income accounted for the bulk of the growth in 29 of the 31 fastest growing counties (the top 1 percent of the nation’s counties) as they continued to rebound from sharp mid-decade declines in farm income…

Personal income is a comprehensive measure of the income of all persons from all sources. In addition to wages and salaries, it includes employer-provided health insurance, dividends and interest income, social security benefits, and other types of income…

Personal income and its components are available for 3,112 counties from 1969 to 2008. In addition, detailed annual estimates of earnings and employment, inflows and outflows of commuters’ earnings, personal current transfer receipts, and farm gross income and expenses by major category for each county are available. A partial sample of the data available is presented in the attached table for New York County, New York. These estimates are the only comprehensive annual measure of economic activity available for counties. Go to www.bea.gov/regional/reis/ to access these estimates.

A narrative describing county, metropolitan area, and state personal income using current estimates, growth rates, and a breakdown of the sources of personal income is available at www.bea.gov/regional/bearfacts/.

Friday, April 23, 2010

Too hot to handle: mortgage arrears in Alberta

The rapid climb in housing prices created the gold rush for real estate in Alberta. Now the economy is no longer roaring, Albertans are left with large mortgages and job uncertainty.

No wonder the mortgage data across Canada shows Alberta to have the highest mortgage arrears across Canada. Following Alberta are the Atlantic provinces in above average mortgage arrears.

World Bank allows access to its data

The World Bank is now allowing access to thousands of datasets, which should help academics and practitioners work with the development data that was restricted to subscribers in the past. The URL for the data initiative is http://data.worldbank.org/.

Hans Rosling makes numbers talk and sing

Hans is a professor of public health who specializes also in data visualization. He has shown how data can inform policy-making.

The following video is a must see for those interested in numbers for decision-making and/or alleviating poverty. Also, you’ll love Hans for his sense-of-humour.

Watch the entire video to see him swallow a sword at the end to make his point:

anything is possible.

http://www.ted.com/talks/hans_rosling_reveals_new_insights_on_poverty.html

Fertility rates and Infant mortality

Why households in poor countries have more children? Is it because of religious reasons, i.e., no contraceptives allowed. Or is it because of disease, i.e., high infant  mortality rates due to disease result in parents having a large number of children because the parents are not certain how many children, if at all, will survive.

The following animation presents data from the World Bank that suggests that with a decline in infant mortality rate over time, the fertility rates declined as well. What could also be extrapolated is that with the decline in the incidence of numerous diseases, the infant mortality rates have declined sharply in certain countries. The lag with fertility rates implies that it would take some time for the fertility rates to decline in response to the lower infant mortality rates.

Each bubble in the animation represents a country.

Tuesday, April 13, 2010

iPad, uPad, we all pad

Is the iPad craze subsiding? A few days after its release one could see that the Internet hype around the product is now settling. The graph below shows a decline in the number of Internet searches conducted on Google for shopping interests.

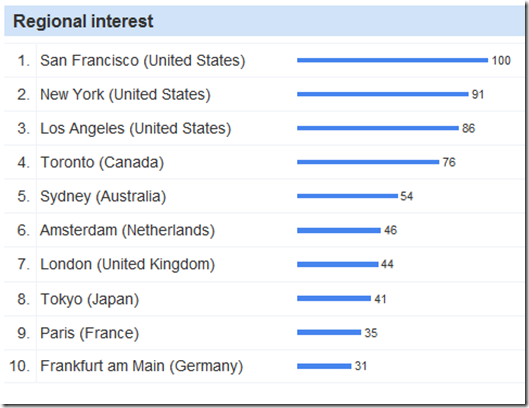
The regional interest is the highest in the United States followed by Japan, Netherlands, Germany, and Canada. China ranked 9th in the web-interest in the product. Even though Canada’s population is much smaller than that of UK or France, Canadians are more intrigued by iPad even though it is not yet available for sale in Canada.

image

The Economic Nostradamus

All forecasts are wrong, some are useful. Despite the uncertainty surrounding forecasts, news media remains obsessed with the ranking of forecasts and forecasters. These rankings obscure the fine point that forecasts are, not can be, wrong and long-term forecasts are more wrong than the sort-term forecasts.

Understanding Economic Forecasts (David F. Hendry and Neil R. Ericsson editors, MIT Press, 2001) lists numerous accounts of how guesswork may also beat sophisticated econometric forecasts!

Below is another ranking of forecasters that has Dr. Sherry Cooper’s team at Nesbitt Burns mentioned as well.

EconAlpha's Staples is man of mystery, and a winner

Consistency lands him on top of forecasting mountain

By Rex Nutting, MarketWatch

WASHINGTON (MarketWatch) -- One of the best economic forecasters is a guy who's never quoted in the newspapers and never yells on CNBC. He just gets the numbers right -- at least more right than anyone else.

You've probably never heard of Spencer Staples, the owner, top economist, and chief bottle washer for a relatively new economic research firm, EconAlpha. Staples is the winner of the March Forecaster of the Month award from MarketWatch, beating out 43 other forecasters.

Indicators Forecast Actual
ism 56.90% 56.50%
nonfarm payrolls -79,000 -36,000
trade gap -$39.9 bln -$37.3bln
retail sales -0.30% 0.30%
housing starts 562,000 575,000
industrial production -0.30% 0.10%
consumer price index 0.00% 0.00%
durable-goods orders 0.90% 0.50%
new home sales 310,000 308,000
consumer confidence 51 52.5

Not only did Staples win the monthly award, he's also now the top forecaster in our contest over the past 12 months, knocking 2009's Forecasters of the Year Nigel Gault and Brian Bethune of IHS Global Insight out of the top spot.

Staples won the March award based on his predictions on 10 top economic indicators released in the month, including the Institute for Supply Management index, the consumer price index and new-home sales. On six of the numbers, his predictions were among the 10 most accurate.

Staples earned his undergraduate degree at Colby College in Maine, and got his career started at Bear Stearns. He went to the United Kingdom 20 years ago and worked for Mizuho Corporate Bank and an investment management company. Along the way, he earned an MBA from the Henley Business School.

He started his own firm in 2008, hoping to provide institutional investors with more consistent forecasts of the high-frequency economic data, the numbers that are released every week or every month, the numbers that tend to move financial markets the most.

Staples says forecasting the high-frequency data takes fundamentally different skills than forecasting over a longer period of time. Long-term forecasters try to eliminate the statistical noise caused by one-time aberrations in the data, such as weather, the timing of holidays and the like. They want to know the trend.

On the other hand, high-frequency forecasters embrace the noise.

Staples takes this further than do many of his colleagues. He flatly refuses to talk about the longer-term trends.

"My strength is in the high-frequency area," Staples said in a phone interview.

Staples says he approaches forecasting as an information-management problem. With so much information now available about every aspect of the economy, the trick is to know what to trust and what to ignore, he said. Asked for an example, he laughed, saying he didn't want to give away his secrets.

Indeed, Staples provides us with less explanation of his forecasts than anyone else in our contest.

Instead of writing hundreds or even thousands of words to explain his forecasts and what the implications might be, as many of his peers do, Staples simply emails us the bare essentials, like this: "February Non-Farm Payroll is expected to be -79K, with the Unemployment Rate at 9.8%." Everything else is "intentionally left blank." It's for the eyes of his clients only.

Staples is convinced that his clients can make money off forecasts that are consistently accurate.

"I think there is alpha imbedded in some forecasts," he said. Normally, investors think of short-term deviations from the trend as volatility, or beta. But Staples suggests that, for some market participants, a good forecast of those deviations can be like a regular dividend check: It's alpha.

This past year, Staples' forecasts have been plenty consistent. No one can get all the numbers right, but he's been more consistent than most. He's finished in the top 15 in our contest in nine of the past 12 months, more times than anyone else.

The runners up in the March contest were Peter D'Antonio of Citigroup Global Markets, Sherry Cooper's team at BMO Capital Markets, Michelle Girard and Omair Sharif of RBS Securities, and tied for fifth: Avery Shenfeld and Meny Grauman of CIBC World Markets and Ethan Harris's team at Bank of America Merrill Lynch.

The median forecasts that MarketWatch publishes each week in the Economic Calendar come from the forecasts of the 10 economists who've scored the highest in our contest over the past 12 months, as well as the forecasts of the most recent winner.

Over the past year, the top economists are, in order: Staples of EconAlpha; Bethune and Gault at IHS Global Insight; Maury Harris of UBS; the RBS team formerly headed by Stephen Stanley; Ethan Harris of Merrill Lynch; D'Antonio of Citi; David Resler of Nomura Securities; John Silvia's team at Wells Fargo Securities; Lou Crandall of Wrightson ICAP; and independent economic consultant Brian Jones.

Monday, April 5, 2010

iPad mania

300,000 sold on the very first day. Millions most likely be sold in the next weeks. Apple’s iPad, touted as the ultimate device for digital media consumption, has been a rave in North America. However, the global response shows that the iPad has generated more craze in the Asia Pacific (Singapore, Hong Kong, Taiwan, South Korea, Philippines, and Australia) than in Europe or North America.

A review of the Google-based searches reveal that Singapore and Hong Kong led the world in web-based hype for the iPad followed by the United States.  The map below shows the geography of interest generated by iPAD in the past three months.

image

The ultimate high for iPAD was observed on January 28, 2010, on the internet when the product was formally revealed by Steve Jobs. Since its release this week, the web-based interest in the product has started to climb again.

Outside of the United States where iPad is available for sale, Toronto in Canada has generated the most interest about iPAD in the past three months ending April 05, 2010.

image